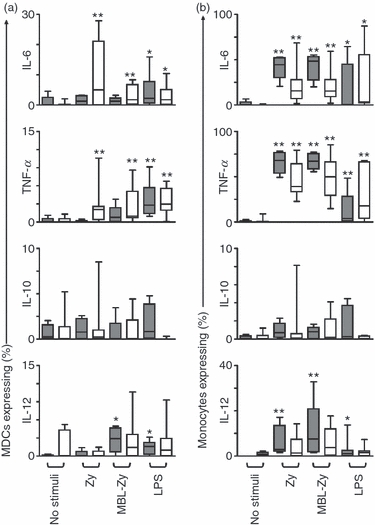
Figure 3.

Inflammatory cytokine profiles of blood myeloid dendritic cells (MDCs) and monocytes. Blood MDCs or monocytes were maintained in whole blood culture with no stimuli, zymosan (Zy), mannose-binding lectin opsonized Zy (MBL-Zy) or lipopolysaccharide (LPS) for 6 hr, stained with monoclonal antibody (mAb) and analysed for inflammatory cytokine profile by flow cytometry. The proportions of blood MDCs (a) or monocytes (b) producing interleukin (IL)-6, tumour necrosis factor (TNF)-α, IL-10 or IL-12 are indicated in the box and whisker plots. Data are representative of five MBL-sufficient (MBL-S; grey filled) and nine MBL-deficient (MBL-D; unfilled) individuals. *P<0·05; **P < 0·01 when compared with MDCs or monocytes of the same group (MBL-S or MBL-D) maintained with no stimuli.
