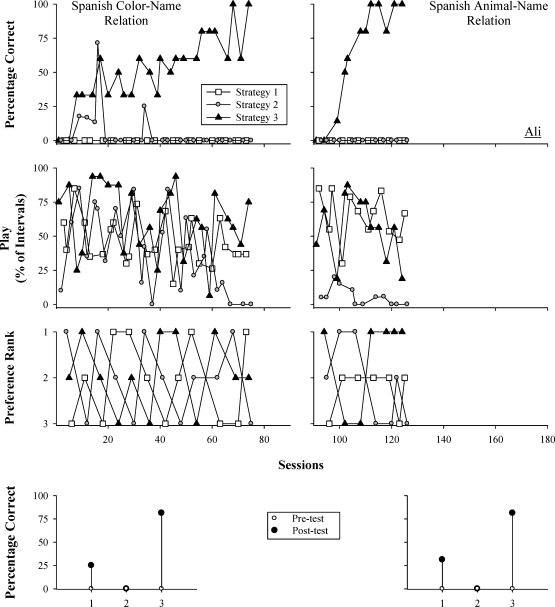
Figure 1.
Percentage of correct responses (top); percentage of intervals with play (second panels); and preference rank, in which 1 represents the first strategy selected and 3 represents the last strategy selected (third panels), during the efficacy and preference evaluations for Ali. Pre- and posttest measures for target relations are depicted in the bottom panels.

