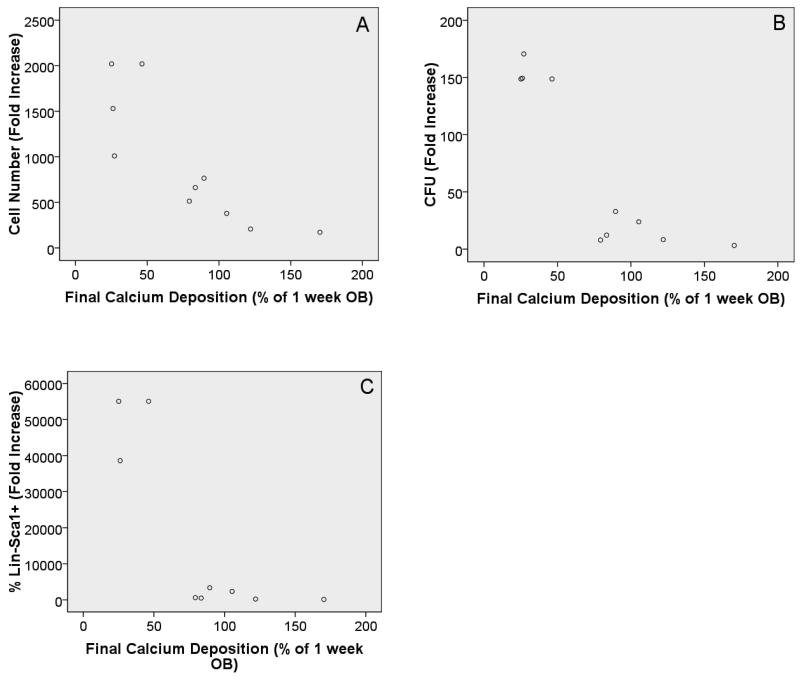
Figure 4.
Scatter plots with final Ca levels on x-axis and cell number fold increase (A), CFU fold increase (B), and percentage of Lin-Sca1+ cell fold increase (C) on the y-axes, respectively. In all cases the R2 value coupled with the ANOVA results are suggestive of a significant relationship between the variables tested. Likewise, in all comparisons the relationship was an inverse association, where the HSC parameter tested increased with lower levels of Ca. Further, for all comparisons it appears that the relationship is more exponential in nature as compared to linear. Final Ca levels refer to levels measured in OB cultures 1 week after initial Ca levels were measured (duration of LSK cell co-culture). Results are reported as a percentage of “1 week OB cultures” (e.g. 1 week OB Ca level =100%). It should be noted that “1 week OB cultures” have been cultured for 1 week alone prior to co-culture for 1 week with LSK cells and cytokines, thus total OB culture duration is 2 weeks.

