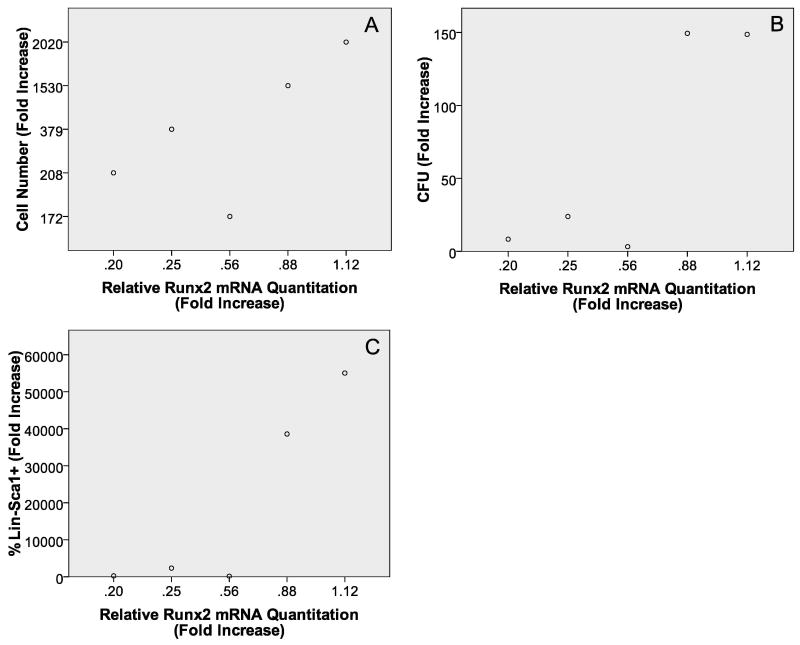
Figure 8.
Scatter plots with Runx2 mRNA expression on the x-axis and cell number fold increase (A), CFU fold increase (B), and percentage of Lin-Sca1+ cell fold increase (C) on the y-axes, respectively. In all cases the R2 value coupled with the ANOVA results are suggestive of a significant linear relationship between the variables tested.

