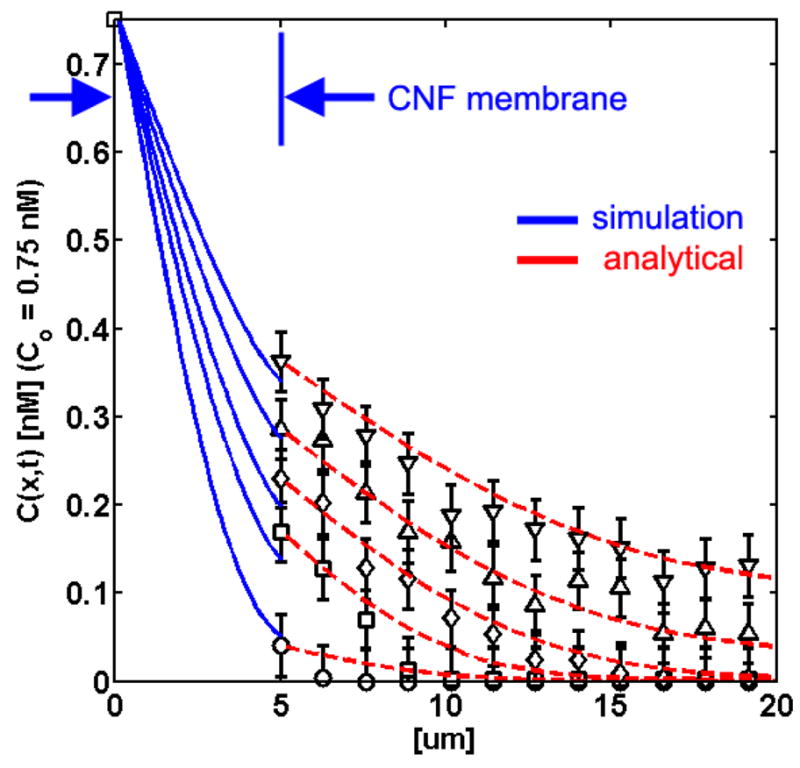
Figure 6.

(a) Concentration gradient profiles at t = 180 (bottom curve), 330, 450, 630, and 810 s (top curve) starting in the microchannel (x = 0 μm, Co,50 nm = 0.75 nM), as simulated through the oxCNF membrane (blue curves) and into the cell mimic interior (black data points, fluorescence experiments). The blue line was generated from a 1D finite difference solution of Smoluchowski’s equation using 〈Da(x)〉 data obtained from a simulation of the random walk of 50 nm beads in a virtual oxCNF forest. The red hatched lines are analytical fits to the concentration profiles for the free diffusion in the obstacle-free, cell mimic interior.
