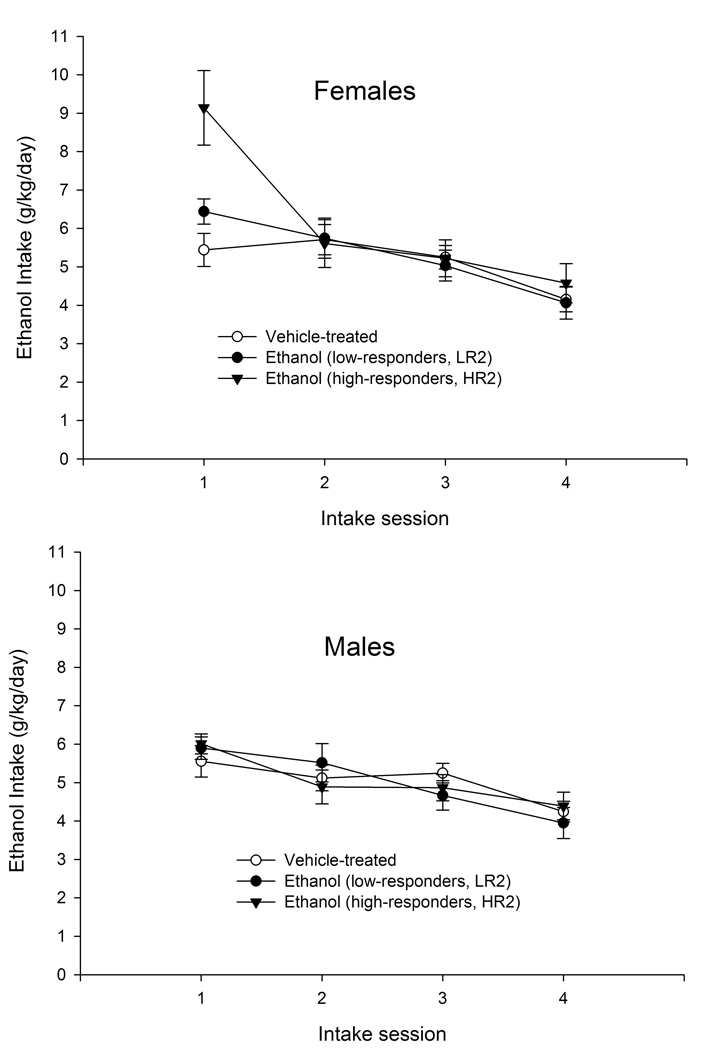
Figure 6.
Left panel: Ethanol intake (g/kg) in female and male adolescent rats during Phase 2 of the intake protocol as a function of day of assessment (sessions 1, 2, 3, and 4) and sensitivity to ethanol treatment at initiation. Right panel: Mean intake of 6% ethanol (g/kg) in adolescent rats during phases 1 and 4 of the intake protocol as a function of sensitivity to ethanol treatment at initiation. Initiation occurred on PD28 and consisted of a single administration of ethanol (2.5 g/kg, i.g.) or its vehicle (0.0 g/kg, tap water). In these panels, ethanol-treated adolescents were divided into high- and low-responders by a split-median procedure that considered the total amount of forward locomotion evoked by ethanol during initiation on PD28. During PD37–52, the adolescents were subjected to a procedure for the assessment of ethanol consumption, which consisted of four phases. The graph in the left panel depicts ethanol intake during Phase 2. This phase lasted for 4 days, in which animals were given continuous, 24 h access to ethanol as the only fluid available in the homecage. The graph in the right panel depicts mean ethanol intake of 6% ethanol across Phases 1 and 4. During these phases adolescents were given daily two-bottle choice tests. On the first session, a 3% v/v ethanol solution was available together with the water. This solution was increased by 1% v/v of ethanol per day until reaching 6% v/v ethanol on session 4. Data in this figure are collapsed across ethanol treatment on PD31 (2.5 or 0.0 g/kg). The vertical bars indicate SEM.

