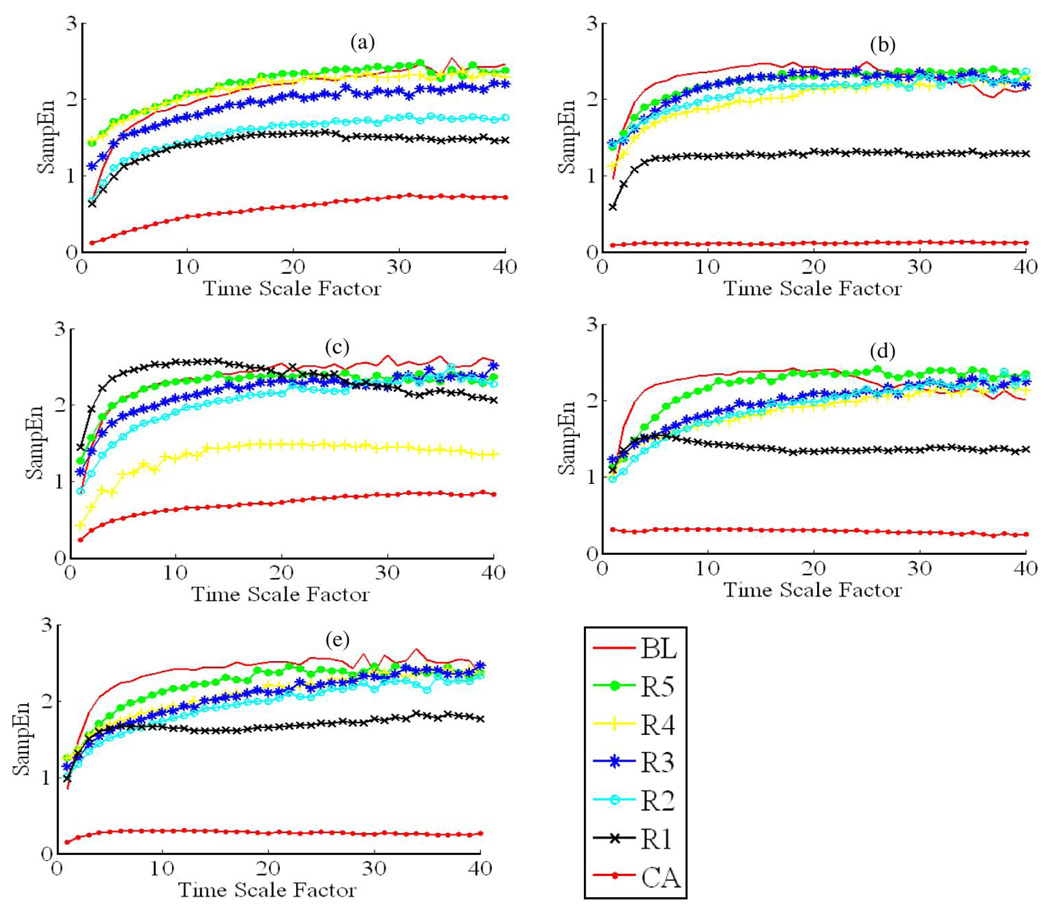
Fig. 2.
MSE curves for the seven different recording phases in all five hypothermia experiments. (a)–(e), respectively, represent the results from MSE analysis for a hypothermia experiment. Take (a) for example, there are seven MSE curves within (a), and each MSE curve corresponds to a recording phase in an experiment from BL to R5 defined in Fig. 3. In each MSE curve, SampEn increases monotonically with time scale factors ranging from 1 to 19, and reaches a “plateau” or “saturation” when time scale factor ranges from 20 to 40. Unlike the conditions in the normothermia group, most of the MSE curves in R5 are very close to or above the MSE curves for BL, along with good recovery outcomes (72-h NDS > 60).

