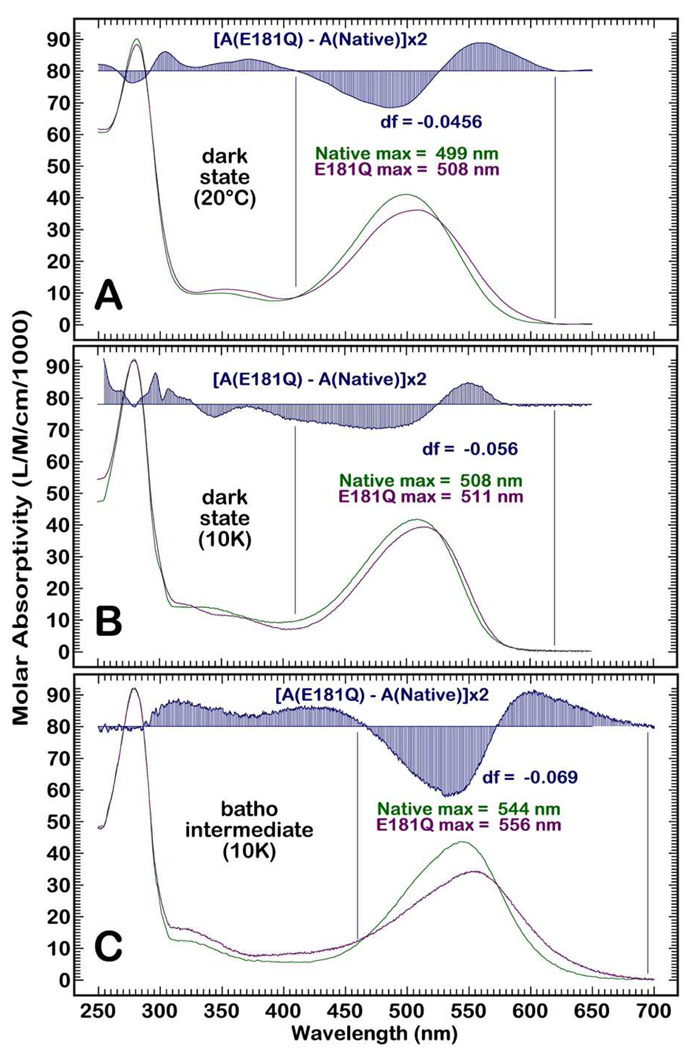
Figure 2.
Absorption spectra of rhodopsin at 20°C (A), at 10K (B) and the batho intermediates at 10K (C) for the native protein (green) and the E181Q mutant (purple). The difference spectra [A(E181Q) – A(native)] multiplied by two are shown in blue above the spectra. The absorption maxima are listed above the spectra, and the change in the oscillator strength of the main absorption band, df, is shown in blue, where a negative number indicates a lower oscillator strength for this band in E181Q. The regions of integration are marked by using vertical blue lines. The absorption maxima are accurate to ±1 nm and the oscillator strengths differences are accurate to ±0.005.

