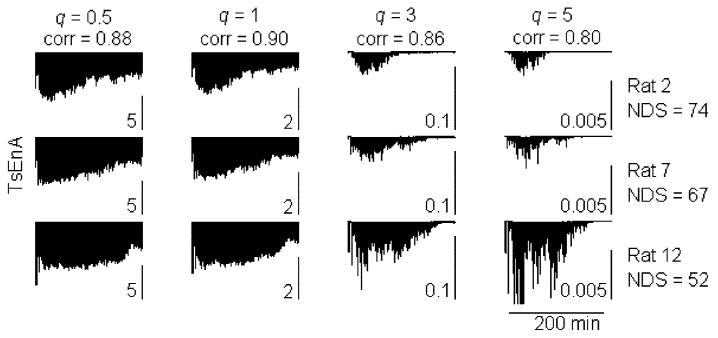
Fig. 7.
Typical TsEnA from three rats calculated with different q. The TsEnA results (left EEG channel) from the same rat with q = 0.5, 1, 3, and 5 are plotted in a row. TsEnA is defined between 22 and 250 min in the whole EEG recording. Subplots in each column hold a same scale. Pearson correlation coefficient (corr) between TsEnA and NDS is also shown on the top of each column.

