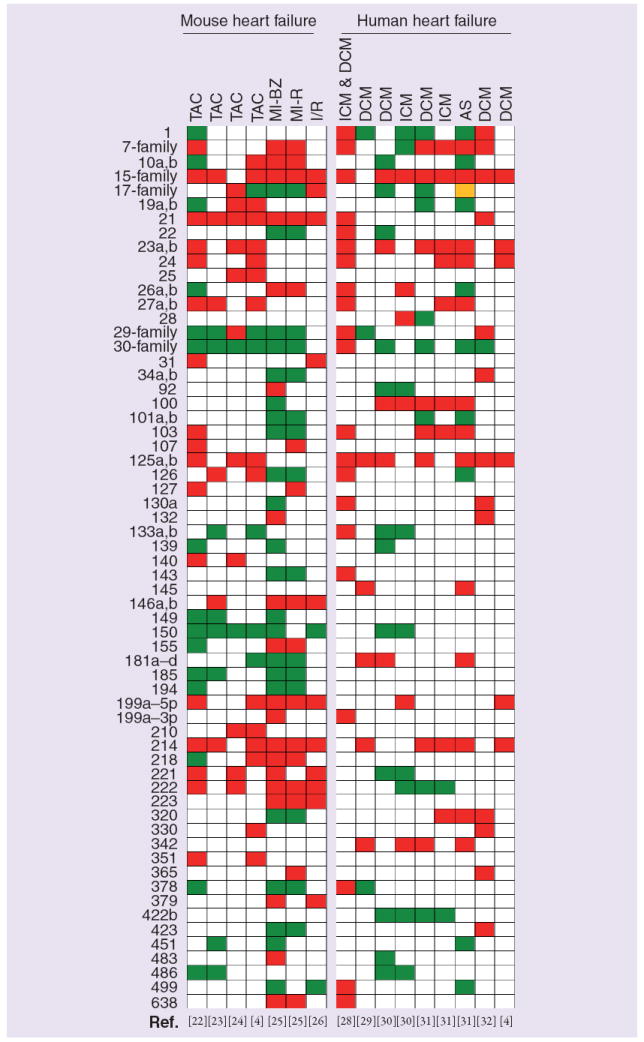
Figure 3. miRNA expression profiles in experimental models and human heart failure.

miRNA expression data from 11 relevant studies were represented in 16 columns. miRNAs that were significantly regulated in at least two independent heart failure studies were included and listed on the left of the heat map. miRNAs that shared the same seed region (nucleotides 2–8) were combined into families. The family was labeled as regulated if at least one member was changed. Red color indicates miRs that were significantly upregulated, green color indicates miRs that were significantly downregulated and yellow color indicates miR families that include members that were regulated in opposite directions. The let-7 family includes let-7b to -7j; miR-15 family, miR-15a,b/16/195/424/497; miR-29 family, miR-29a to -29c; miR-30 family, miR-30a to -30e; and miR-17 family, miR-17-5p/20a,b/93/106a.
AS: Aortic stenosis; BZ: Borderzone; DCM: Dilated cardiomyopathy; ICM: Ischemic cardomyopathy; I/R: Ischemia reperfusion; MI: Myocardial infarction; R: Remote; TAC: Thoracic aortic banding.
