
Figure 1.
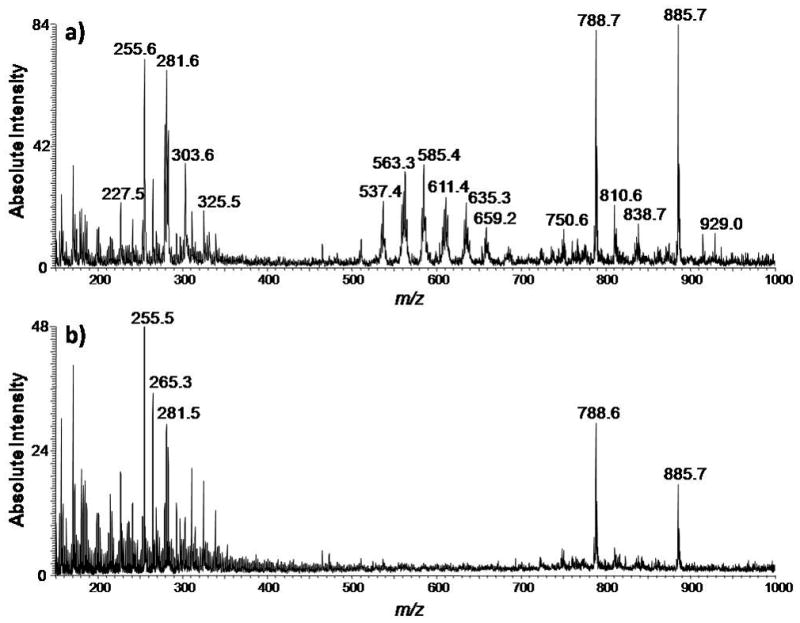
Typical negative ion mode full-scan mass spectra of human bladder cancer tissue and adjacent normal tissue in the range of m/z 150–1000. a) Negative ion mode spectrum of the tumor region of the tissue sample of UH0112-37. b) Negative ion mode spectrum of the normal region of the tissue sample of UH0112-37.