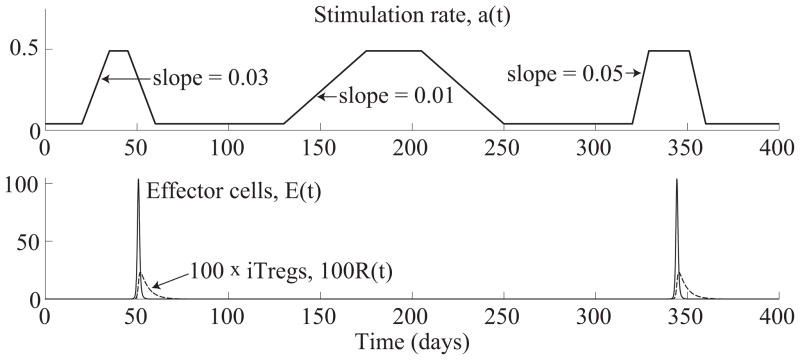
Figure 5.4.
(Top) Antigen stimulation rate, a(t), given by (5.3). (Bottom) Time evolution of effector and iTreg populations, E(t) and R(t), from system (5.1). The system produces an effector response against the first and third increases in stimulation starting on days 120 and 320. The effector cell concentrations, E(t), peak on days 50.8 and 344.3.

