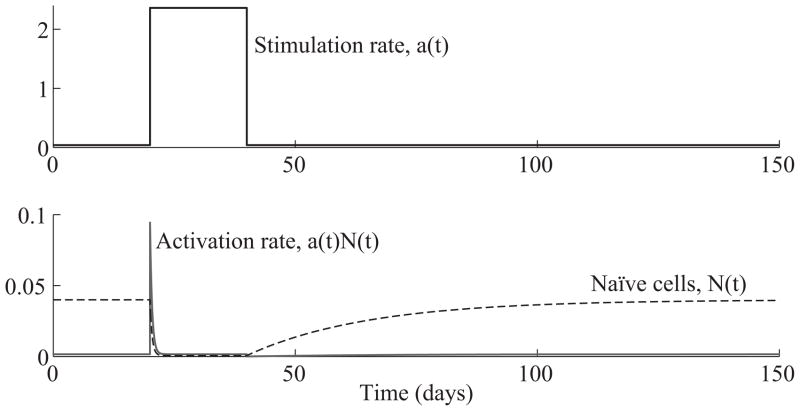
Figure 2.3.
(Top) Antigen stimulation rate, a(t) = 0.04 + 2.32 · 1[20,40)(t). (Bottom) Time evolution of the naïve T cell population, N(t), and the activation rate, a(t)N(t). The steady state value of the activation rate is the same as the supply rate s = 0.0016. When the antigen stimulation rate is constant at a, the equilibrium population of naïve T cells equals s/a. The activation rate spikes at the moment that the stimulation rate increases.

