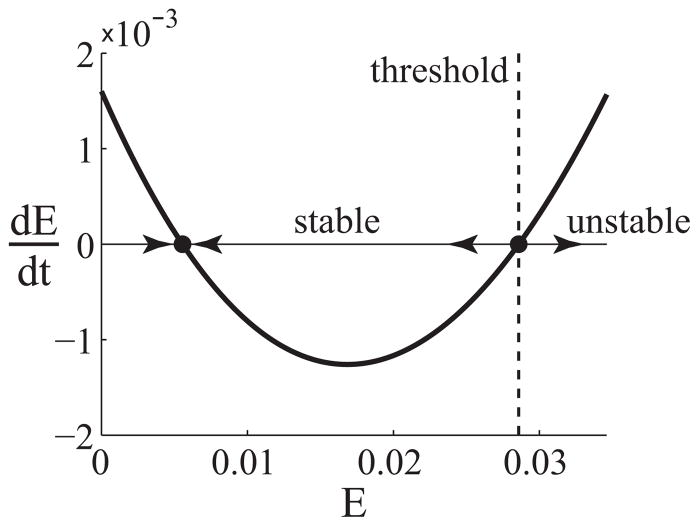
Figure 3.2.
Plot of dE/dt as a function of E, given by (3.2). For initial values x(0) below the stability threshold, x(t) will move toward the stable fixed point. For initial values x(0) above the threshold, x(t) grows exponentially. Parameters: s = 0.0016, dE = 0.35, k = 20, r1 = 0.62, r2 = 100, dp = 5.5

