
Figure 5.
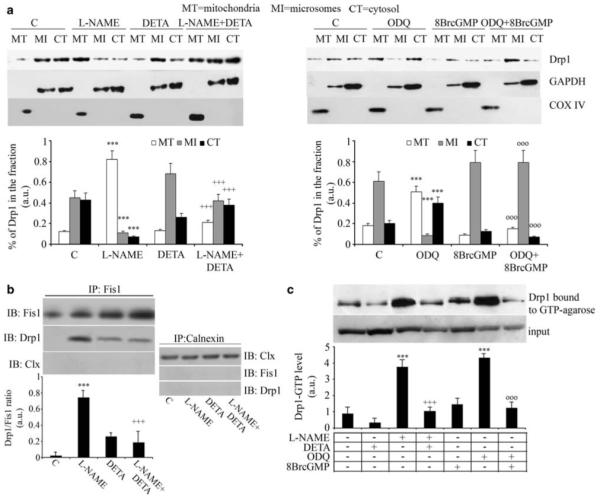
NO and cGMP control the activity and localization of Drp1. Myogenic precursor cells were differentiated for 6 h and treated for 1 h with l-NAME, ODQ, DETA-NO, 8Br-cGMP or vehicle (C), added as indicated. (a) Cells were fractionated and the mitochondrial (MT), microsomal (MI) and cytosolic (CI) fractions were examined for Drp1 content by western blotting, using GAPDH and COX-IV as loading controls for cytosolic and mitochondrial proteins, respectively. The results shown in the images are representative of five reproducible experiments, which are quantified in the corresponding graphs. (b) Co-immunoprecipitation of Drp1 with Fis1 was performed using the an anti-Fis1 Ab for immunoprecipitation (IP). The amount of co-immunoprecipitated Drp1 was determined by immunoblotting (IB) using a specific anti-Drp1 Ab. As control the amount of Fis1 immunoprecipitated was also checked by IB. As a further control for specificity we checked the absence of co-immunoprecipitation of Drp1 with calnexin. (c) Drp1 GTPase activity was measured in pull-down experiments using GTP-conjugated beads. The representative images shown in panels b and c are from four independent reproducible experiments. The graphs below each image report the densitometric values±S.E.M. of the relevant band from the four experiments. In all panels, the asterisks, crosses and circles show statistical probability (P<0.001), calculated versus C, l-NAME and ODQ, respectively