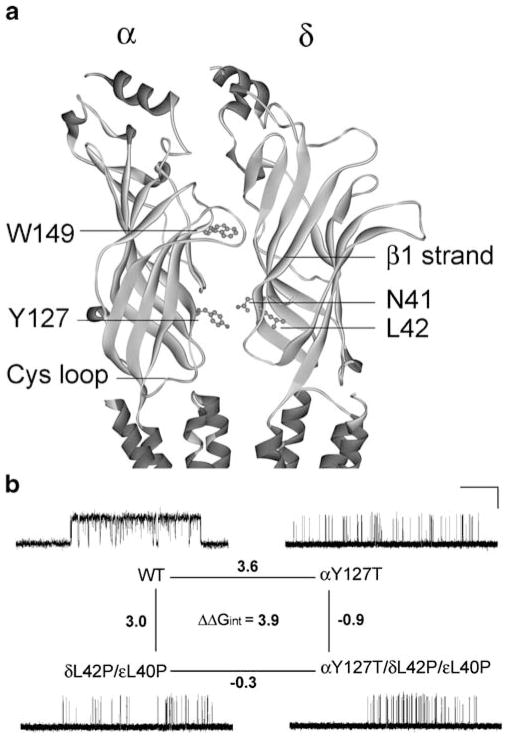
Figure 6.
Structural model of the AChR α and δ subunits and mutant cycle analyses. a An enlarged view of the coupled intersubunit residues αY127 and δN41 in the structural model of the Torpedo AChR (Protein Data Bank code 2BG9). b A mutant cycle for the mutations αY127T, δL42P, and εL40P. Single-channel currents correspond to each AChR elicited by 100 μM ACh. Changes in gating free energy along each limb of the cycle are shown, and the overall coupling free energy (ΔΔGint) in units of kilocalories per mole computed from −RT ln[(θwwθmm)/(θwmθmw)] where the θ(β/α) is the gating equilibrium constant for diliganded receptors for wild-type, single-mutant, or double-mutant AChRs. Horizontal bar indicates 20 ms for wild-type AChRs and 100 ms for the mutant AChRs. Vertical bar indicates 5 pA. (Reproduced by permission from Shen et al. 2008)

