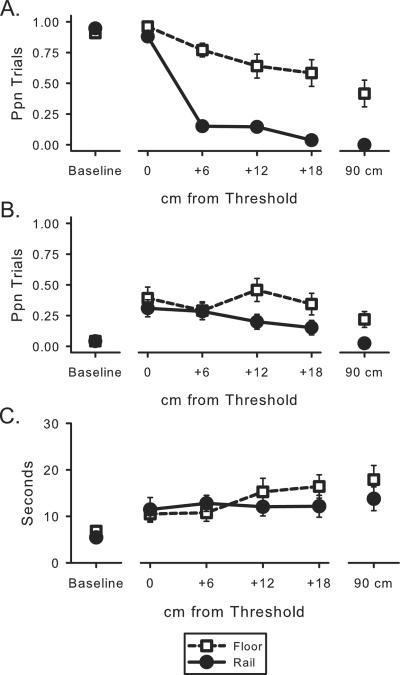
Figure 3.
Cruisers' attempts and exploration on safe and risky gaps. (A) Cruise ratio: (successful + failed attempts to cruise)/(successes + failures + refusals to cruise). (B) Exploratory limb extensions into gaps. (C) Latency to embark over gaps. Data are plotted according to relative amount of risk. The 0 point on the x-axis represents each infant's gap threshold in each condition. Baseline gap size was 2 cm in the floor-gap condition and 16 cm in the handrail-gap condition. Error bars represent standard errors.

