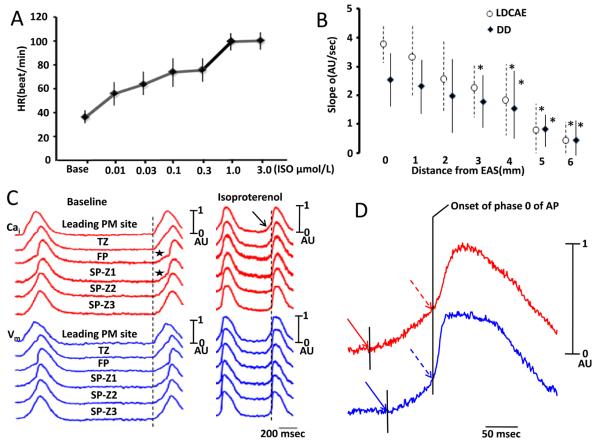
Figure 3.
Effects of isoproterenol. A, Dose-response relationship between heart rate (HR) and isoproterenol (ISO). B, The relationship between the slope and distance from the leading pacemaker (LP) site for late diastolic Ca elevation (LDCAE) and diastolic depolarization (DD). Asterisks indicate significant difference (P≤0.05) between the slopes at the EAS and at sites distant from EAS. C, The Cai (red) and Vm (blue) tracings at baseline and during isoproterenol infusion. At baseline, the initial portions of the FP and SP-Z1 (indicated by asterisks) showed gradual rise of Vm, suggesting that these sites have recorded optical signals from anatomical layers that activated earlier. During isoproterenol infusion, LDCAE (arrow) occurred before phase 0 (vertical dashed line) of the leading pacemaker. D, Magnified view of Cai and Vm tracings of AVN during isoproterenol infusion. The onset of LDCAE (solid red arrow) was noted before the onset of AP (solid blue arrow). Red dashed arrow indicates peak LDCAE and blue dashed arrow indicate peak diastolic depolarization. The vertical line segment indicates the onset of the phase 0 of action potential. EAS, earliest activation site; PM, pacemaker.

