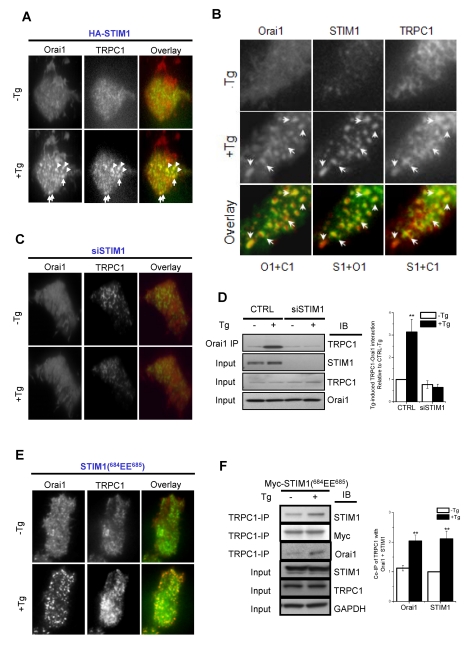
Figure 4. STIM1 determines clustering of TRPC1 and Orai1 in ER/PM junctional domains following Ca2+ store depletion.
TIRFM was used to detect localization of TRPC1, STIM1, or Orai1 in HSG cells. (A) Localization of YFP-TRPC1 and CFP-Orai1 in HSG cells co-expressing HA-STIM1 before (−Tg) or 5 min after Ca2+-store depletion (+Tg). Left and central panels show localization of Orai1 and TRPC1 (shown by white arrows); right panels show co-localization of the proteins (Orai1-CFP, red, and YFP-TRPC1, green) with arrows showing examples of overlay (yellow) of TRPC1 and Orai1 punctae after Tg stimulation. (B) Similar experiment done with cells co-expressing Orai1-CFP, YFP-TRPC1, and mCherry-STIM1. To make the co-localization clear, in the overlay images, O1+C1 (TRPC1 is green, Orai1 is red), S1+O1 (Orai1 is green, STIM1 is red), and S1+C1 (STIM1 is red and TRPC1 is green). Arrows show examples of overlaying Orai1, TRPC1, and STIM1 punctae after Tg stimulation. (C) Localization of YFP-TRPC1 and Orai1-CFP in siSTIM1-treated HSG cells either with or without Tg (green signal indicates TRPC1 while red signal indicates Orai1). (D) Blot on left shows co-IP of endogenous TRPC1 and Orai1 in control and siSTIM1-treated cells (minus or plus Tg). Anti-Orai1 antibody was used for IP while anti-TRPC1 was used for IB. Inputs for TRPC1, STIM1, and Orai1 in each condition are shown in the lower three panels. The bar graph on the right shows quantitation of the blots from four similar experiments. ** indicates values significantly, p<0.01, different from controls, which are not different from each other. (E) TIRFM images of Orai1-CFP and YFP-TRPC1 in HSG cells expressing STIM1(684EE685). In the overlay, Orai1 is shown in red while TRPC1 is shown in green, with yellow indicating co-localization of the two proteins. (F) Tg-induced Co-IP of TRPC1, Orai1, and STIM1 in HSG cells expressing Myc-STIM1(684EE685) in resting conditions and after stimulation with Tg. Anti-TRPC1 antibody was used for IP and anti-Orai1; STIM1 or TRPC1 was used for IB, as indicated. Inputs and control blots are also shown. Quantitation of data from four similar experiments is shown by bar graph on the right, ** indicates values significant at p<0.01.

