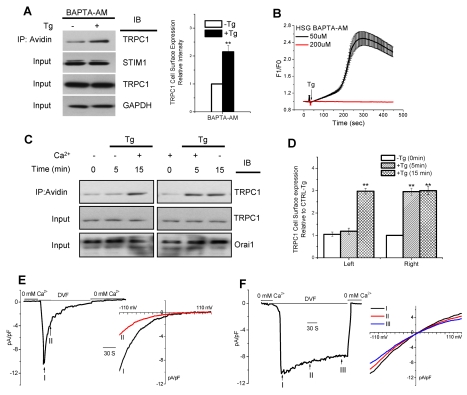
Figure 5. Local [Ca2+]i determines plasma membrane insertion of TRPC1.
(A) Tg treatment and biotinylation were carried out with HSG cells loaded with 200 µM BAPTA-AM (as described in Materials and Methods), and quantitation of TRPC1 in the fraction pulled down with avidin is shown on the right. The change induced by Tg is not significantly less than that seen in control cells in Figure 3. (B) Tg-stimulated increase in fura-2 fluorescence was measured in HSG cells loaded with either 50 µM or 200 µM BAPTA-AM. (C) Biotinylation of TRPC1 in cells treated under the conditions indicated in the figure. Levels of TRPC1 and Orai1 in the cell lysates are shown in the blot. (D) Quantitation of blots from four similar experiments as shown in (C) depict the increase in TRPC1 in the biotinylated fraction relative to control. ** indicates values significantly different from unmarked values but not from each other. (E, F) Effect of extracellular Ca2+ on detection of ISOC. HSG cells were either incubated for 10–15 min with Tg in nominally Ca2+-free medium (E) or Ca2+-containing medium (F). Cells were then patched in the Ca2+-free condition and then switched to DVF medium. In each case, current developments are shown by traces on the left and I–V curves of the current measured at the indicated time points are given on the right.

