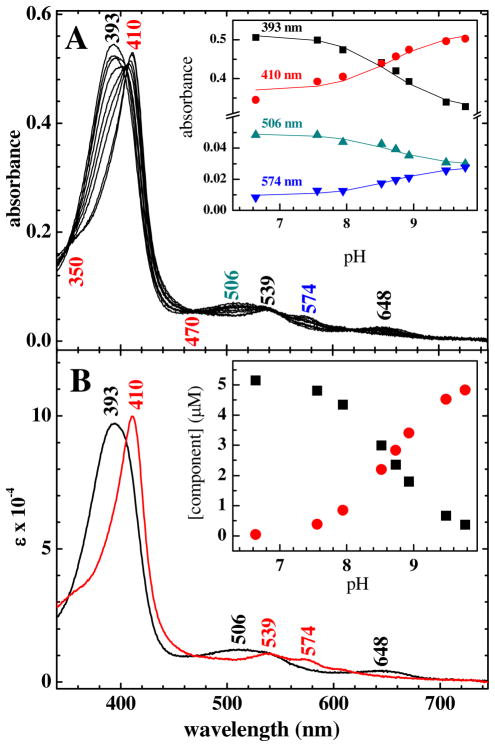
Figure 2.
A) UV-visible titration data for ferric Cld over the pH range 6.6–9.8. Spectra are shown at pH 6.6, 6.8, 7.6, 7.9, 8.5, 8.7, 8.9, 9.5, and 9.8. Peak maxima and isosbestic points (at 350 and 470 nm) are labeled. Inset: Points correspond to absorbance at the indicated wavelengths. The solid lines are the calculated titration curves obtained from the two-component global nonlinear least squares analysis. B) Calculated component spectra obtained from the global analysis. Peak maxima are labeled. Inset: Speciation plot showing concentrations of the two components as a function of pH.

