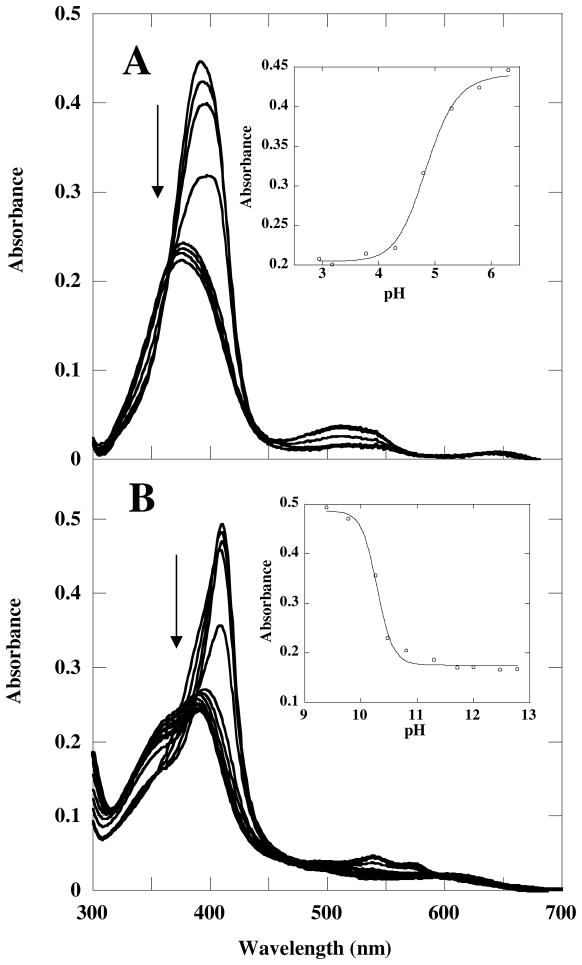
Figure 3.
A) UV-visible titration data for ferric Cld over the pH ranges A) 6.3–2.9 and B) 8.8–12.8. A) Spectra are shown at pH 6.3 (Soret at 393 nm), 5.8, 5.3, 4.8, 4.3, 3.8, 3.2 and 2.9 (Soret at 374 nm). The inset shows the absorbance at 393 as a function of pH, with an apparent pKa of 4.8 ± 0.1. B) The Spectra are shown at pH 8.8 (Soret at 410 nm) 9.1, 9.4, 9.8, 10.3, 10.5, 10.8, 11.3, 11.7, 12, 12.5 and 12.8 (Soret at 390 nm). The inset shows the absorbance at 410 nm as a function of pH with an apparent pKa of 10.3 ± 0.1. Note that the titrations resulted in irreversible inactivation of the enzyme. The measured transitions are consequently not true pKas.

