
Figure 9.
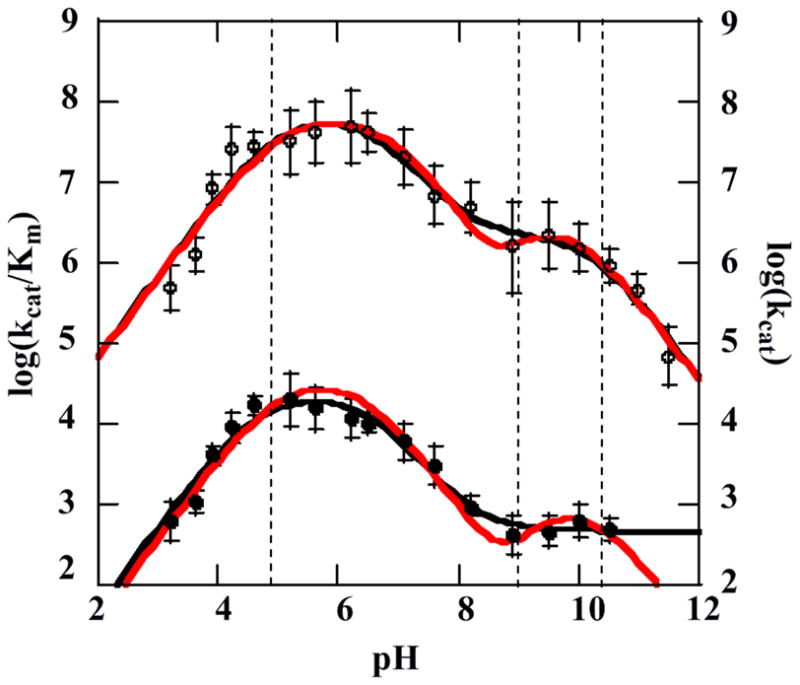
Plots of the log(kcat) (closed circles, bottom) and the log(kcat/Km) (open circles, top) for the chlorite decomposition reaction as a function of pH. Data are fit to model 1 (black line) and model 2 with pKa(1) and pKa(4) fixed (red line). Dashed vertical lines show the locations of the three optically observed pH transitions at pH 4.8, 8.7, and 10.3, from Figures 2 and 3.