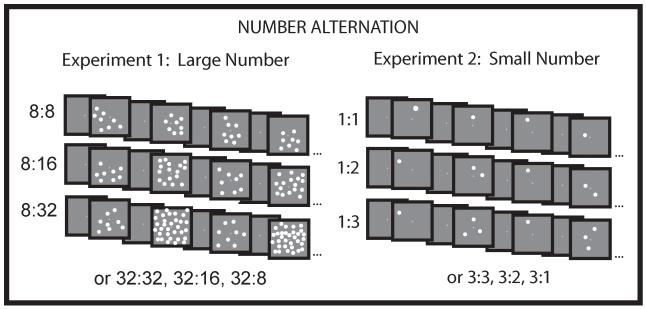
Figure 1.
Schematic depiction of the number alternation conditions presented to infants. Images depict low base conditions for both experiments; the numbers used in the high base conditions are presented underneath the images. Each image was presented for 500 ms and followed by the presentation of a cross in the middle of the screen for an interval that varied randomly in duration from 500-1000 ms.

