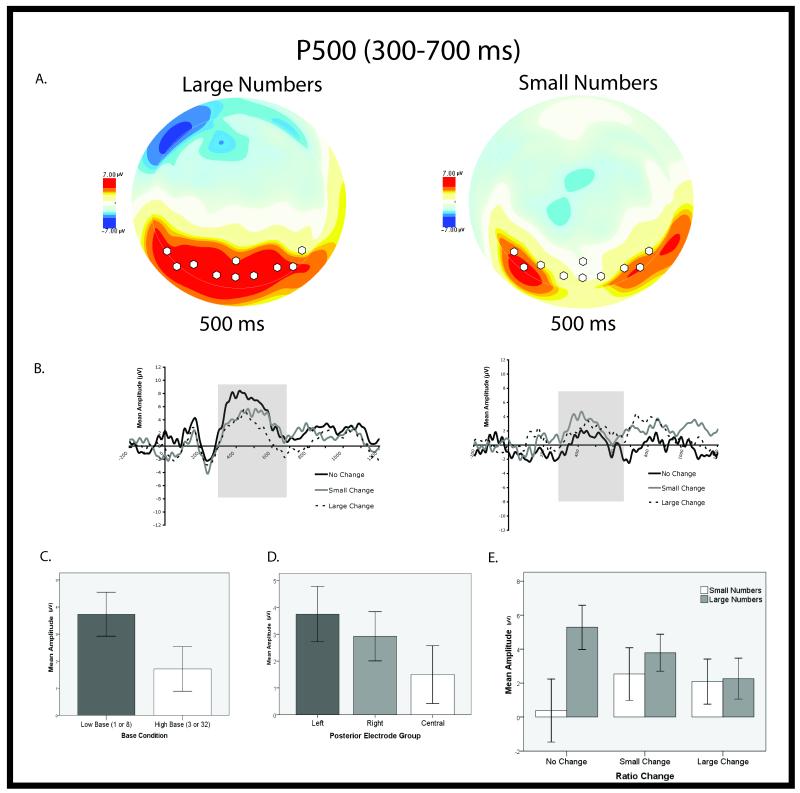
Figure 2.
Results of parietal P500 analysis. (A). Overhead view of scalp topography for both experiments at 500 ms. White circles represent electrode grouping used to calculate mean amplitude. (B). Average evoked waveform over posterior parietal sites from −200 before stimulus presentation to 1200 ms after for both experiments. (C). Graph depicting main effect of Base Condition on mean P500 amplitudes. Error bars represent 95% confidence intervals. (D). Graph depicting main effect of Electrode Grouping on mean P500 amplitude. Error bars represent 95% confidence intervals. (E). Graph depicting interaction between Numerical Range and Ratio Change on P500. Error bars represent 95% confidence intervals.

