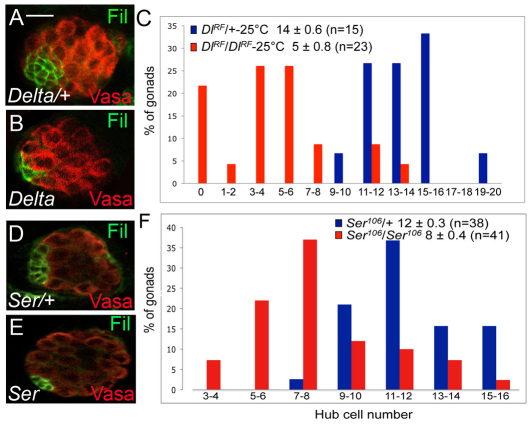
Fig. 4.
Serrate and Delta both contribute to hub cell fate. (A,B,D,E) First larval instar gonads from (A) Dlts/+, (B) Dlts/Dlts, (D) Ser106/+ and (E) Ser106/Ser106 raised at 25°C. Filamin (green, hub) and Vasa (red, germ cells). Scale bar: 10 μm. (C,F) Distribution of the number of hub cells in Dlts/+ (blue) and Dlts/Dlts (red) gonads (C, P<0.0001 by Student's t-test) and Ser106/+ (blue) and Ser106/Ser106 (red) gonads (F, P<0.0001) is shown. The average number of hub cells per gonad (±s.e.m.) and the number of gonads (n) observed is also shown.

