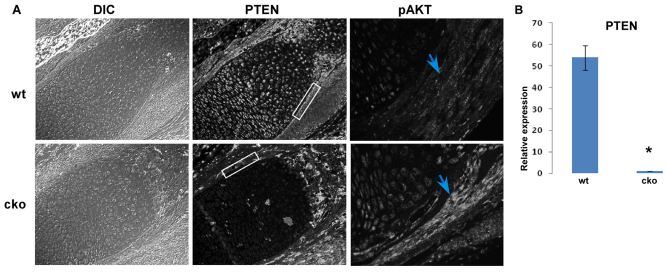
Fig. 1.
Knockout of Pten using Dermo1cre. (A) Immunofluorescence images showing the loss of PTEN in both chondrocytes and osteoblasts (white boxes). The top panel shows wild-type (wt) tibial sections and the bottom panel shows those of the conditional knockout (cko) mouse. The right-hand panel shows the concomitant increase in pAKTSer473 (blue arrows) following PTEN deletion using Dermo1cre. Differential interference contrast (DIC) images are shown on the left. (B) Relative mRNA levels from wt and Dermo1cre Pten cko calvarial osteoblasts isolated from newborn pups (n=3, *P<0.05). Error bars indicate s.d.

