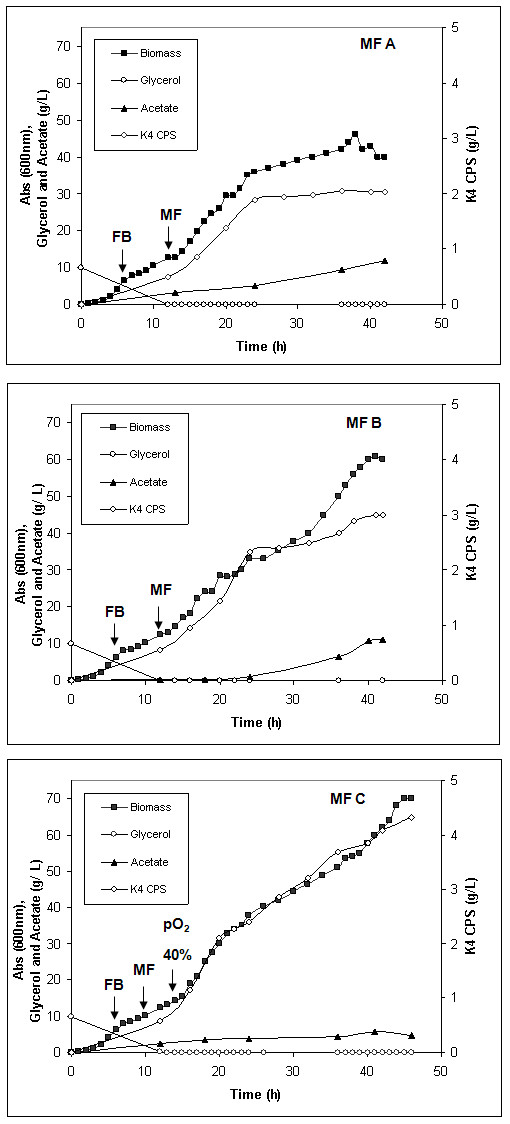
Figure 4.

Microfiltration experiments. E. coli K4 three different MF experiments: growth, glycerol consumption, acetate and K4 CPS production. The arrows indicate the starting points of fed-batch phase (FB), microfiltration phase (MF) and of the eventual increase of the pO2 setting (pO2 40%).
