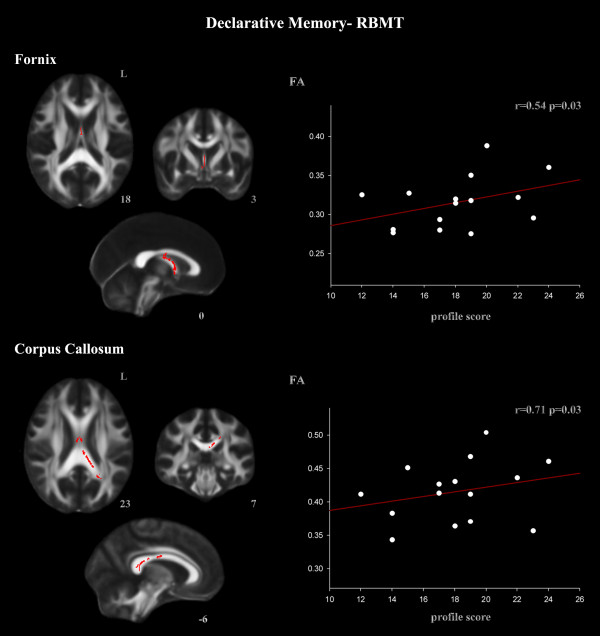
Figure 3.
ROI correlations with RBMT in the TBI group: RBMT correlated with the fornix and the corpus callosum ROIs (TFCE, p < 0.05 FWE-corrected). Correlation coefficient (r) was directly converted from t values of the TBSS output. The t and r values correspond to the most statistically significant voxel for each cluster.

