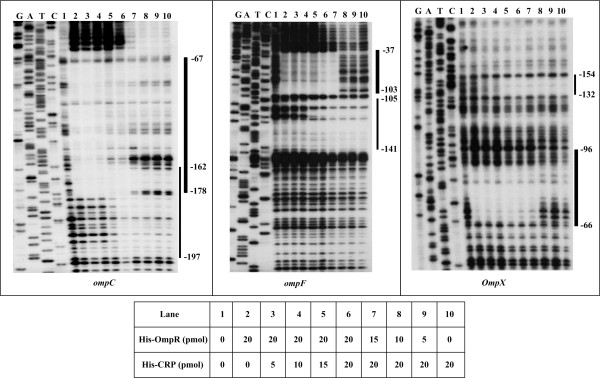
Figure 6.
Competitive DNase I footprinting analysis. The labeled coding strand of the promoter-proximal DNA fragment of each indicated gene was incubated with His-OmpR, His-CRP or both in the presence of acetyl phosphate and cAMP for DNase I footprinting assay. The thick bold lines indicate the OmpR protected regions, while the thin ones denote CRP footprints. The numbers also indicate the nucleotide positions upstream the transcriptional start sites. We also show the amounts of His-OmpR and His-CRP used in each lane.

