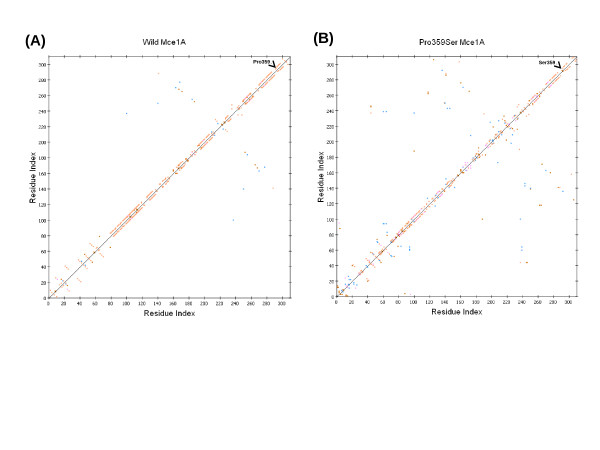
Figure 4.
HB plot representation of wild and mutant Mce1A protein. HB plot of wild (A) and Pro359Ser mutant (B) Mce1A protein. Break in the diagonal at position 359 in the HB plot of Pro359Ser indicates loss of hydrogen bond after mutation. Conformational changes in other regions could be attributed to the alteration of hydrogen bonds in these regions. Colours of the dots in the HB plot indicated the type of hydrogen bond interactions: side chain-side chain (blue), main chain-main chain (orange), main chain-side chain (red) and multiple hydrogen bonds between amino acid residues (pink) The figures were prepared using Discovery studio 2.5 (DS Modeling 2.5, Accelrys Inc.: San Diego, CA).

