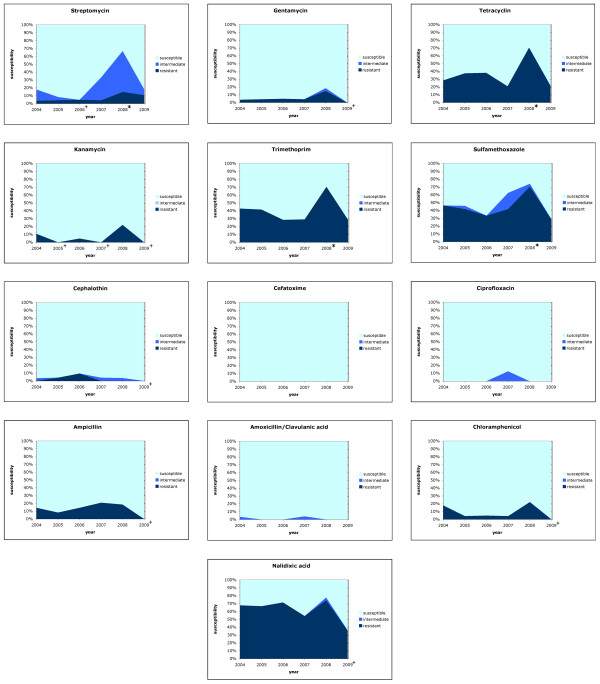
Figure 2.
Resistance of S. Virchow strains isolated over the years 2004 trough 2009 in Switzerland. Each box shows the percentage fraction of the resistant, intermediate and susceptible sub-population over time for one antimicrobial. Values significantly (p < 0.05) deviating from average are marked with * (more resistant) or + (less resistant), respectively.

