Figure 5.

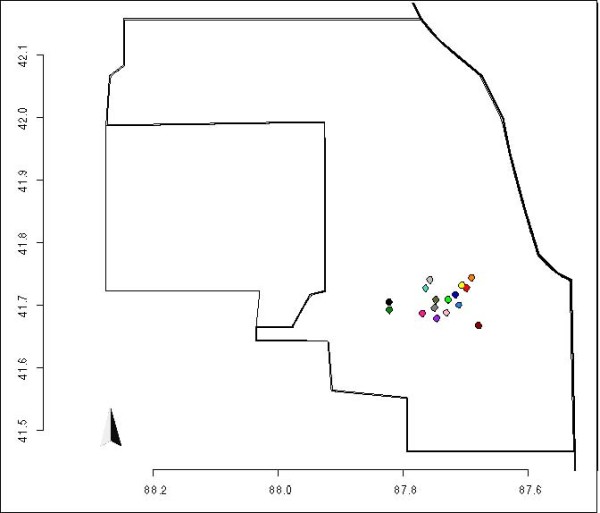
Map of WNV samples. Map representing Cook and DuPage counties, and the collection sites used in [30]. Each site has a color, that is the same of the tips of the samples collected in it.

Map of WNV samples. Map representing Cook and DuPage counties, and the collection sites used in [30]. Each site has a color, that is the same of the tips of the samples collected in it.