
Figure 5.
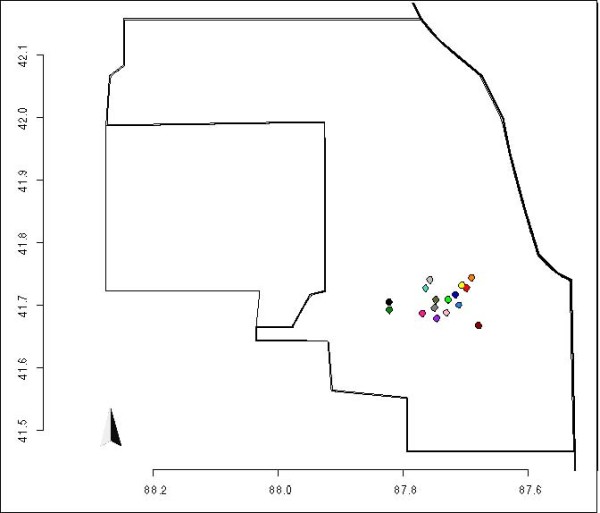
Map of WNV samples. Map representing Cook and DuPage counties, and the collection sites used in [30]. Each site has a color, that is the same of the tips of the samples collected in it.
Official websites use .gov
A
.gov website belongs to an official
government organization in the United States.
Secure .gov websites use HTTPS
A lock (
) or https:// means you've safely
connected to the .gov website. Share sensitive
information only on official, secure websites.
Map of WNV samples. Map representing Cook and DuPage counties, and the collection sites used in [30]. Each site has a color, that is the same of the tips of the samples collected in it.