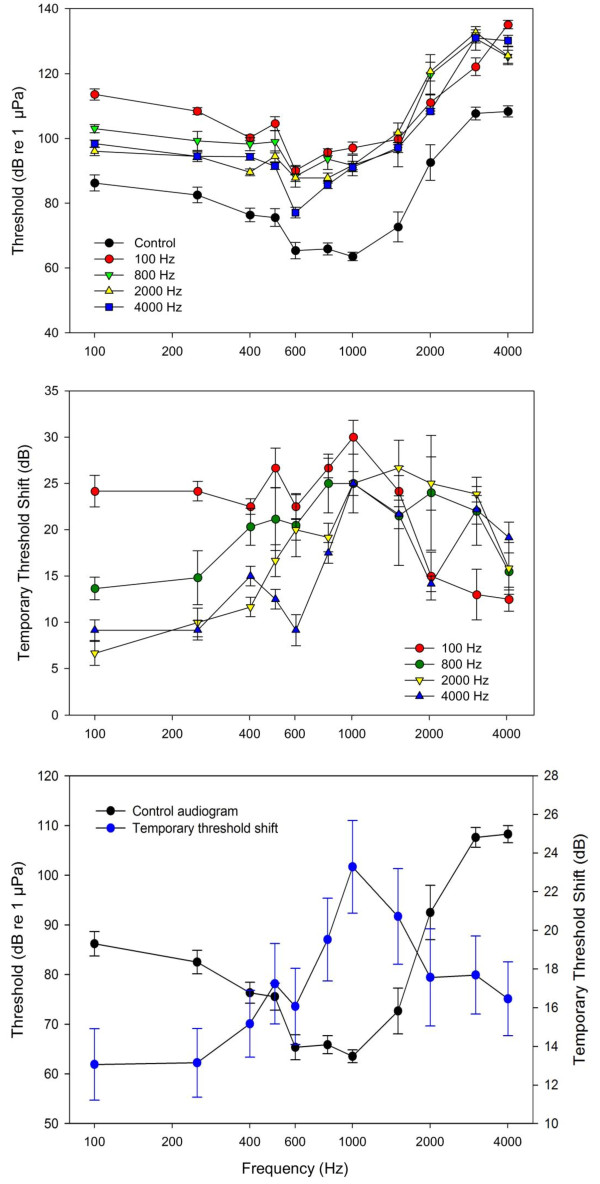
Figure 7.
Effect of tone frequency on auditory thresholds and temporary threshold shifts in goldfish. (A) Auditory evoked potential (AEP) thresholds of control and experimental goldfish exposed to one of four tones. (B) Temporary threshold shift (TTS; calculated as threshold after sound exposure minus mean control levels) for the four tone exposures. (C) Control goldfish audiogram plotted with mean threshold shift averaged across all tone exposures to show that hearing loss was greatest at frequencies that goldfish are most sensitive (i.e., near 1 kHz). Values are means ± S.E; N = 6 per data point.

