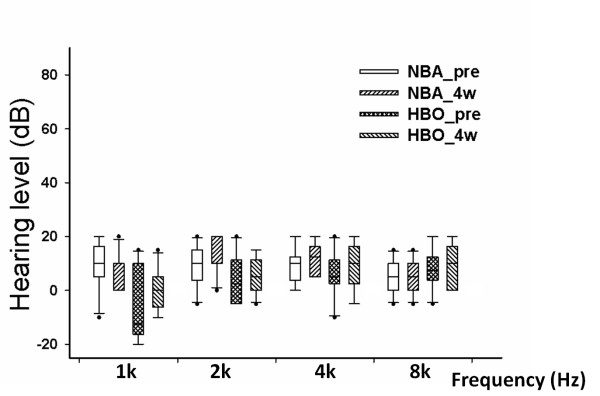
Figure 2.
Auditory level. Box plots of the hearing level in the control, normobaric air (NBA) group and the experimental, hyperbaric oxygen (HBO) treatment group before (_pre) and 4 weeks after (_4w) the treatment sessions. There were no significant intra-group changes or inter-group differences in the hearing levels before and 4 weeks after the start of the treatment. X-axis indicates the different frequencies for auditory measurement, from 1 k to 8 k Hz. The dots represent the outliers.

