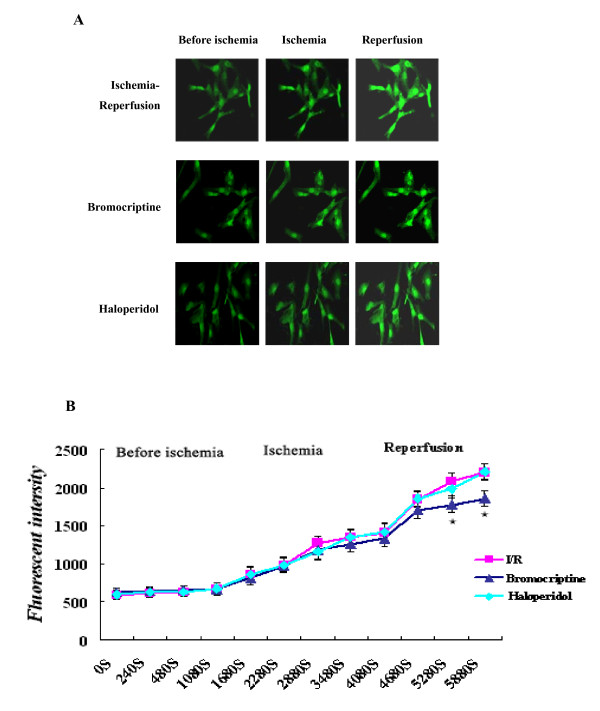
Figure 3.
Changes of intracellular free calcium concentration. (A) Fluorescent images of cardiomyocytes incubated in DMEM, or incubated in simulated ischemia solution and re-incubated in DMEM in the presence or absence of 10 μM bromocriptine or haloperidol, respectively. (B) Changes in fluorescent intensities of intracellular Ca2+ in different treatment groups were recorded continuously with confocal laser scanning microscopy. Intracellular Ca2+ was recorded for a total of 98 min. ★P < 0.05 versus ischemia/reperfusion.

