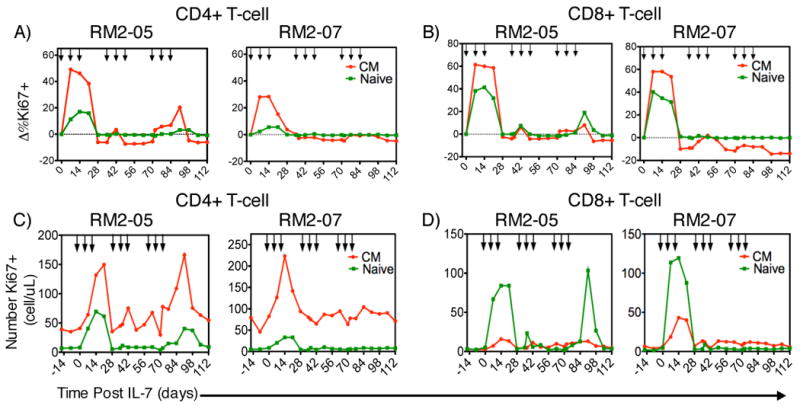
Figure 5. Ki67 response and change in Ki67+ T-cell levels with clustered dosing.

Two macaques treated with stable ART therapy were administered rsIL-7gly at weekly intervals for three weeks followed by a two-week wash out period. Proliferation in peripheral T-cell subsets was monitored by flow cytometry assessing the fraction of Ki67+ cells. Each rsIL-7gly dose is indicated by [↓]. The change in Ki67 expression from baseline levels is shown. Central memory (CM) (red); naïve cells (green) (A) CD4+ T cells (B) CD8+ T cells. We also determined the absolute number of proliferating cells in each macaque in each subset central memory (CM) (red); Naïve cells (green) (C) CD4+ T cells (D) CD8+ T cells.
