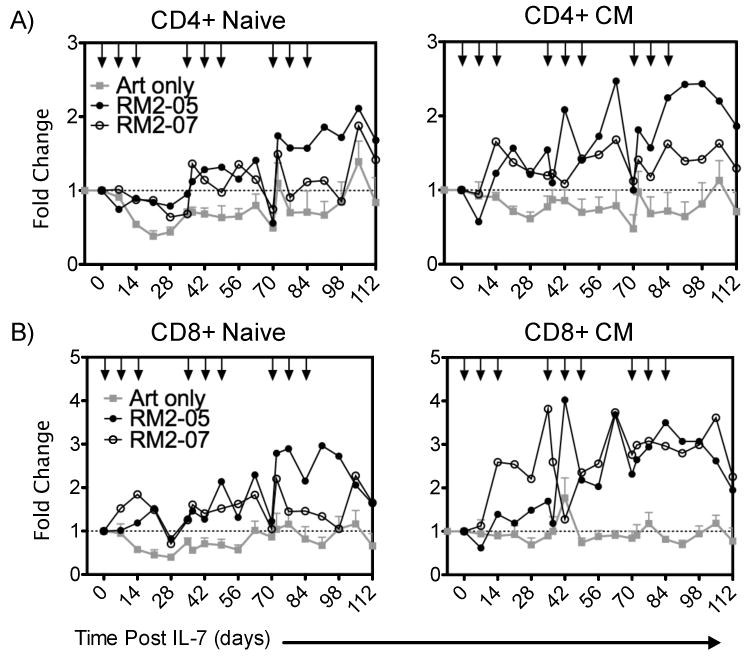
Figure 6. Fold change in T-cell levels following clustered dosing administration.

Where applicable rsIL-7gly administration is indicated [↓]. The mean absolute T-cell count of four macaques treated with ART alone (grey square), RM2-05 (closed circle) RM2-07 (open circle) is shown in each figure (mean ± SEM). (A) Fold change in CD4+ T-cell subsets naïve and central memory (CM) (B) Fold change in CD8+ subsets naïve and central memory (CM).
