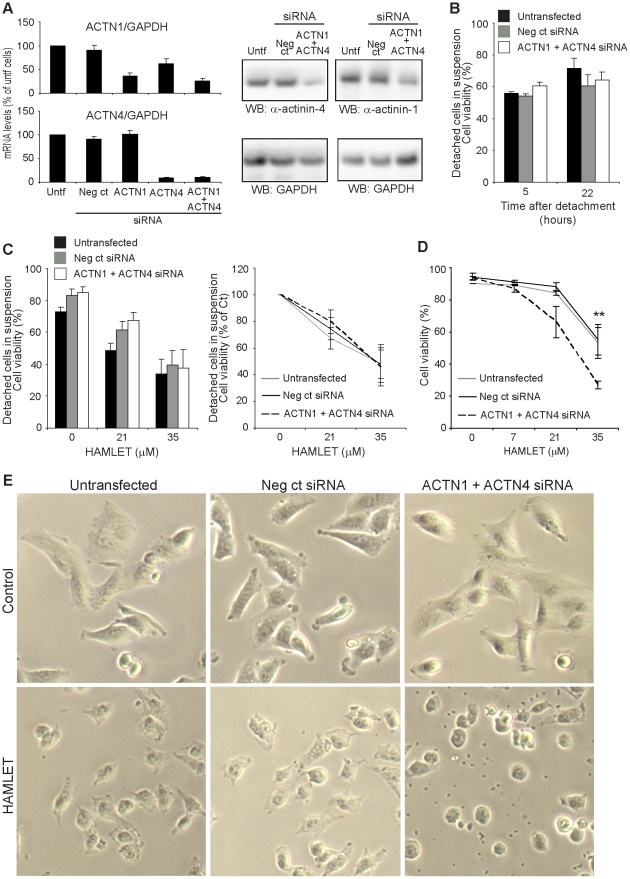
Figure 7. Cell detachment and death.
A) α-Actinin siRNA knockdown was quantified by RT-PCR (means + SEMs of 4 experiments) and Western blot. B) Cells that were kept in suspension for 22 hours showed the same viability indepently of α-actinin levels by trypan blue exclusion. C) HAMLET treatment of cells in suspension (non-transfected, control siRNA-transfected or α-actinin siRNA-transfected) did not show a difference in sensitivity as determined by trypan blue exclusion. The left diagram shows the absolute numbers while the right diagram shows cell death in % of control. D) By trypan blue exclusion, tumor cell death was increased in adherent cells with low α-actinin levels (means ± SEMs of 4 experiments, ** p<0.01). E) By light microscopy, the cells with low α-actinin levels show a more rapid change in morphology in response to HAMLET than the cells with normal α-actinin levels. The rounding up was more pronounced in cells with low α-actinin levels.

