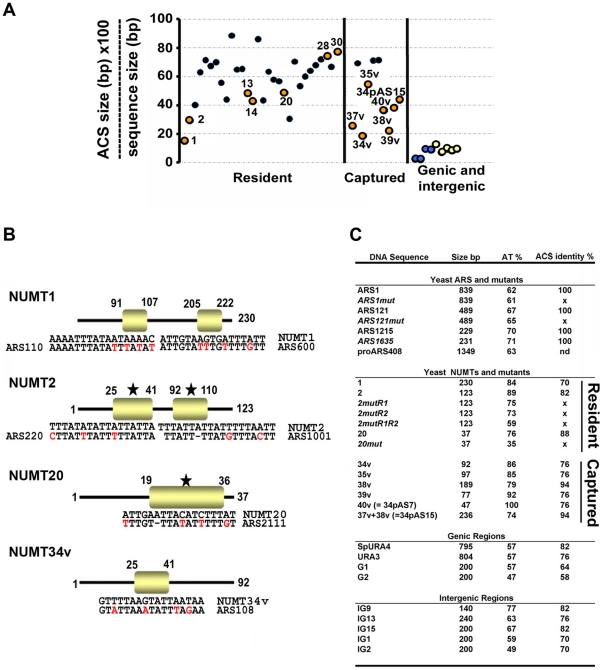
Figure 1. Paradigm to investigate origins of replication in Saccharomyces cerevisiae.
(A) Density of ACS motifs within a given sequence. On the X-axis is indicated the type of sequence analysed, and on the Y-axis the percentage of the sequence (in bp) occupied by ACS motifs. Coloured dots indicate sequences that have been analysed in this study. In several cases the name of the sequence is indicated. Significantly different values for the group of S. cerevisiae NUMTs versus the group of genic and intergenic regions (p = 1.4×10⁻¹¹) according to the t-Student test. (B) Sequence and position of the 17 bp ARS core-A motif (ACS) (rectangle) in several NUMTs. The sequence of confirmed ACS is shown below. A star indicates the ACS motif that has been mutated in this study. (C) Summary of the sequences, carrying either NUMT or non-NUMT sequences (Tables S1 and S2), inserted in pIRT2Δ, pRS405 and pRS405-CEN. Nd = not identified; Sp = S. pombe. “v” indicates captured NUMTs [5]. The nomenclature of yeast NUMTs is adapted from reference [5].

