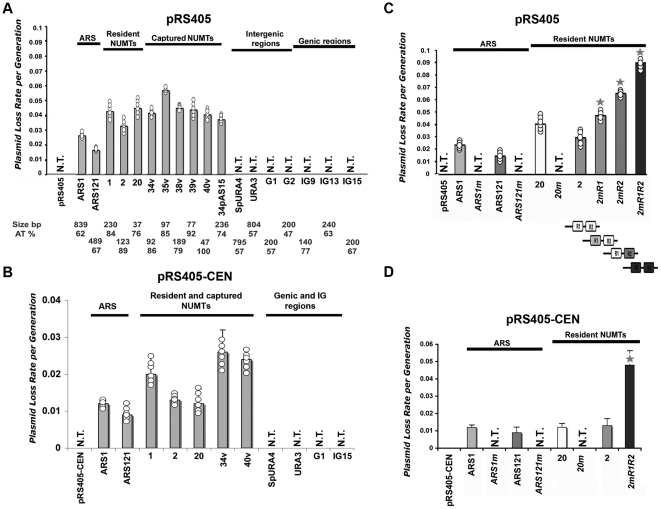
Figure 2. Plasmids carrying NUMTs display low loss rate in yeast.
Plasmid loss rate per generation measured in 6 independent transformants (circles) per construct (average ± standard deviation). When values are identical, only one circle is shown. (A) Analysis with vector pRS405. ARS1 and ARS121 are positive controls. The empty vector as well as the insertion of random control sequences are unable to promote plasmid replication, therefore they do not support colony growth (N.T., for no transformants). Insertion of an ARS or a NUMT sequence activates plasmid replication and colony growth, therefore plasmid loss rate was measurable in these samples. The size and the AT content of each sequence are indicated in the bottom (B) Analysis with vector pRS405-CEN, a pRS405 derivative that contains the centromeric region CEN4. (C–D) Replication activity with mutated ACS. Plasmid loss rate following ARS and NUMT mutagenesis (“m”) to replace the 17-bp ACS motif in vectors pRS405 and pRS405-CEN. A star shows a significant difference between the mutated sequence and the corresponding original sequence (n = 6; p<0.05, Mann-Whitney test) (C) Vector pRS405. Mutation of the motif in both ARS and in NUMT20 results in complete loss of replication activity (no transformants, N.T). Mutation of one or both ACS motifs in NUMT2 (shown in dark rectangles in the scheme below) results in a progressive increase in plasmid loss rate. (D) Vector pRS405-CEN. Mutation of the motif in both ARS and in NUMT20 results in complete loss of replication activity (no transformants, N.T). Mutation of one or both ACS motifs in NUMT2 results in a progressive increase in plasmid loss rate.

