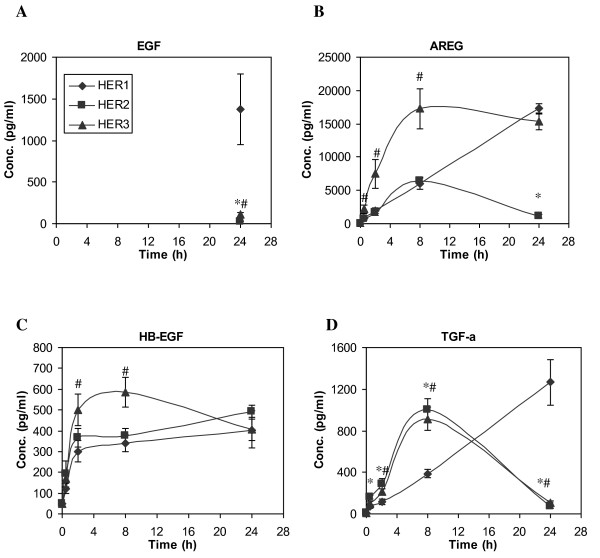
Figure 1.
Time course of HER ligand secretion in HME cell lines expressing different levels of HER receptors after addition of 12 ng/ml EGF to the culture medium. Conditioned medium (CM) was collected at 0, 0.5, 2, 8 and 24 h after EGF addition, and ELISA microarray analysis was used to determine the concentrations of A) EGF, B) AREG, C) HB-EGF and D) TGF-α in CM samples from the parental HER1 cell line (diamonds), HER2 (squares, cell line engineered to overexpress HER2 in addition to the endogenous expression levels of HER1 receptor) and HER3 (triangles, a cell line engineered to overexpress HER3 and has endogenous expression levels of HER1). Except at t = 24 h, EGF concentrations were over the detection limit. Therefore, EGF concentrations at early time points are omitted. Data points and crossbars represent the mean and standard deviation of five replicates, each from a separate culture dish. The symbols denote statistically significant differences between the parental HER1 and HER2 (*) or HER3 (#) by both analysis of variance and Fisher's protected least significant difference analysis.

