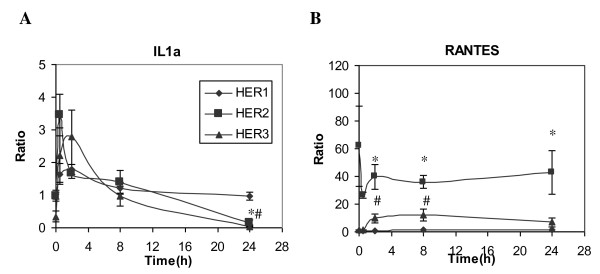
Figure 10.
RT-PCR analysis of IL-1α and RANTES. Relative mRNA levels of A) IL-1α and B) RANTES gene expression were examined in HMEC parental HER1 cell (diamonds), HER2 (squares) and HER3 (triangles) using quantitative RT-PCR. Total RNA was extracted from cell samples treated with 12 ng/ml EGF for 0, 0.5, 2, 8 or 24 h. Each mRNA expression level was normalized with respect to its expression in parental cells at t = 0 h. Error bars represent one standard deviation from the mean of three biological replicates. The symbols denote statistically significant differences between HER1 and HER2 (*) or HER3 (#) by both analysis of variance and Fisher's protected least significant difference analysis.

