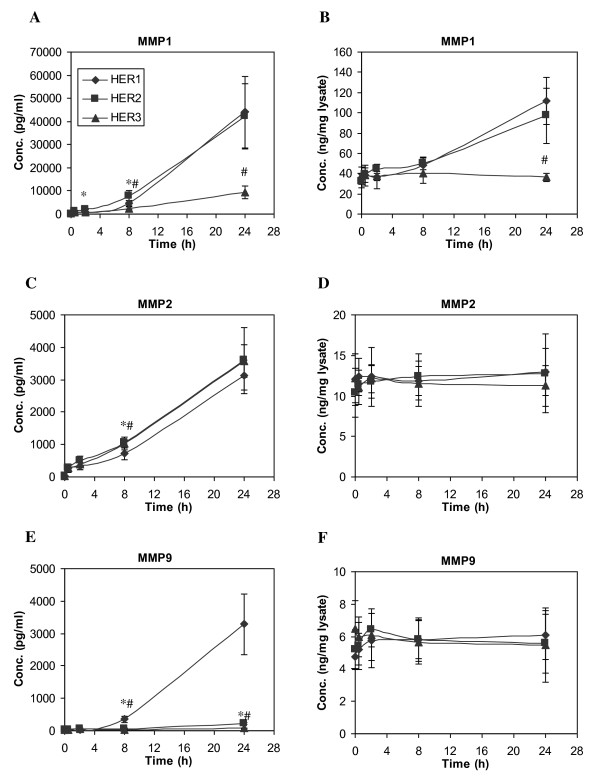
Figure 7.
Time courses of MMP concentration change. HME cell lines expressing different levels of HER receptors were treated with 12 ng/ml EGF for up to 24 h. Both CM and its corresponding cell lysate were collected at t = 0, 0.5, 2, 8 and 24 h. Concentrations of MMP1, MMP2 and MMP9 in CM (A, C and E) and cell lysate (B, D and F) were detected from samples of parental HER1 cell line (diamonds), HER2 (squares) and HER3 (triangles). Error bars represent one standard deviation from the mean of five biological replicates. The asterisks denote statistically significant differences between HER1 and HER2 (*) or HER3 (#) by both analysis of variance and Fisher's protected least significant difference analysis.

