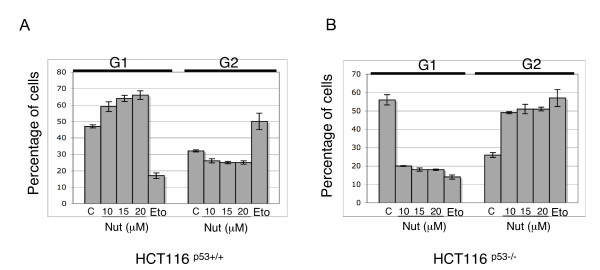
Figure 4.
Nutlin-3 induces p53-independent cell cycle checkpoint controls. HCT116p53+/+ and HCT116p53-/- cells were treated with either 0, 10, 15 or 20 μM Nutlin-3 (Nut) or 100 μM of Etoposide (Eto). After 18 hours, cell cycle distribution was assessed using flow cytometry. (A) Chart showing percentage of HCT116p53+/+ cells in either G1 or G2 cell cycle population following either Nutlin-3 or etoposide treatment as described above. (B) Chart showing percentage of HCT116p53-/- cells in both G1 and G2 cell cycle population following either Nutlin-3 or Etoposide treatment as described above.

