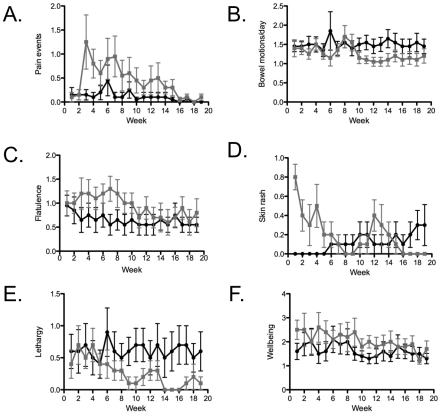
Figure 4. Symptom responses to hookworm infection.
Control group is indicated by black circles, hookworm group by grey squares, values are mean +/− SEM. (A) pain events, (B) bowel motions/day, (C) flatulence, (D) skin rash, (E) lethargy, (F) wellbeing. Area under the curve analysis followed by Mann-Whitney U test to compare between groups showed that pain events (A) was significantly different between the groups.

