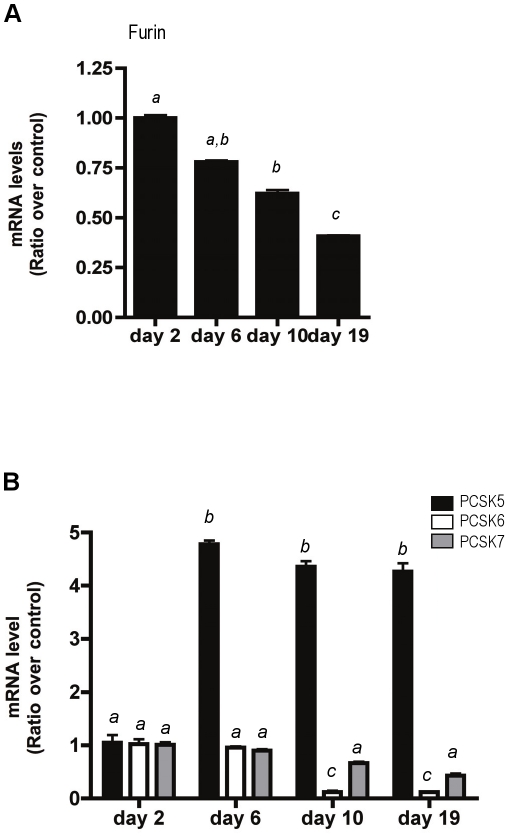
Figure 2. Expression of PCSKs in the postnatal mouse ovary.
(A) Basal expression levels of furin mRNA in developing mouse ovaries was determined by real-time RT-PCR. The furin mRNA levels are shown as a ratio over the day 2 ovary mRNA levels (control). The bars labeled with different letters indicate statistically significant differences, as determined by Tukey's multiple comparison test (p<0.05). (B) Basal expression levels of PCSK5, PCSK6 and PCSK7 mRNA in developing mouse ovaries were determined by real-time RT-PCR and are shown as a ratio over day 2 ovary mRNA levels (control). The bars labeled with different letters indicate statistically significant differences, as determined by a two-way ANOVA followed by Bonferonni post-tests (p<0.05).

