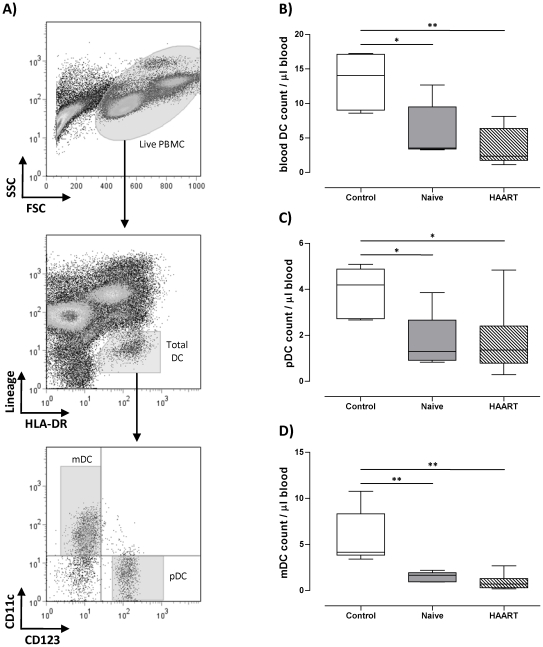
Figure 1. pDC and mDC counts are reduced in HIV-1 infection.
A) The gating strategy used to identify blood pDC and mDC within PBMC. B) C) and D) show total DC, pDC, and mDC counts per ul of blood respectively. DC counts were calculated based on their percentages within PBMC, total PBMC live counts (Trypan blue exclusion method), and the volume of blood collected. * and ** indicate P values less than 0.05 and 0.01 respectively (Mann Whitney U test).

