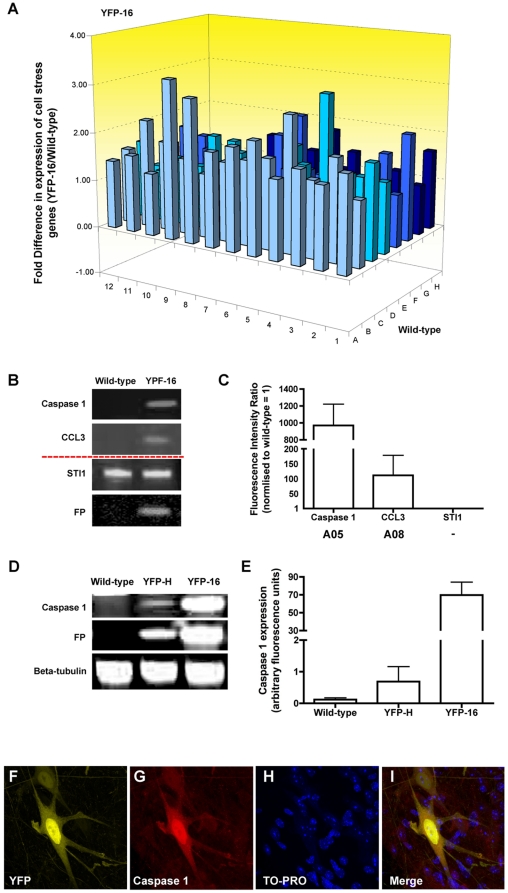
Figure 1. YFP expression activates cell stress responses in neurons in vivo.
A – 3D bar chart showing fold-differences in mRNA expression levels for 84 cell stress related genes comparing spinal cord from YFP-16 mice with wild-type mice (N = 3 samples, each consisting of pooled tissue from 3 mice). Note that we only observed increased expression of cell stress related genes. B – Representative fluorescent western blots for cell stress proteins in the spinal cord of wild-type and YFP-16 mice. Both caspase 1 (Casp1) and CCL3 had increased expression in YFP-expressing tissue, whereas STI1 (a stress protein not on the array) remained at the same levels found in wild-type mice and YFP (FP) was only present in YFP-16 tissue. C - Bar chart (mean ± s.e.m.) showing quantification of protein expression levels in YFP-16 spinal cord (normalised to wild-type: fluorescence intensity ratio of 1 = identical to wild-type), confirming increased expression levels of CCL3 and caspase 1 (N = 3 samples, each consisting of pooled tissue from 3 mice). D/E - Representative fluorescent western blots and bar chart showing caspase 1 expression in the spinal cord of wild-type, YFP-H (low YFP expression) and YFP-16 (high YFP expression) mice. Increased levels of caspase 1 correlated with the amount of YFP present. F-I - Representative confocal micrographs showing caspase 1 immunohistochemistry (red = caspase 1; yellow = YFP; blue = TO-PRO) in the spinal cord of a YFP-H mouse. Increased caspase 1 immunolabelling was restricted to YFP-positive neurons. Scale bar = 20 µm.

